Using AWS Managed Grafana with Timestream for Observability: Infrastructure Setup
In part one of a three-part series, we explain the technological infrastructure behind our new internal dashboarding system.
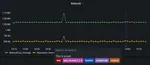
Network Ninja software engineers recently implemented the AWS Managed Grafana Service as a fully managed internal dashboarding solution, allowing us, among other things, to monitor network traffic across hundreds of applications (example of the final result below).
We chose Grafana because:
- It allows us to visualize and analyze data from multiple sources,
- It co-exists with our AWS infrastructure (allowing us to manage access via IAM policies), and
- It supports single sign-on (SSO).
Since there wasn’t a comprehensive guide to accomplishing what we wanted, we wrote one - and broke it up into three digestible sections. Part 1 (which follows below) covers setting up Timestream and connecting it to Grafana, while Parts 2 and 3 will explain Timestream Queries and Scheduled Tasks & Graph Annotations, respectively.
Tech Infrastructure
For simplicity, we chose to use a combination of AWS Timestream and Cloudwatch for our metrics datastore. Using a push-based model instead of polling means no inventory and service discovery to worry about - that works well in a cloud environment where instances may come and go. We also like the balance of memory and magnetic storage, since most of the time when we’re looking at dashboards, we’re looking at recent history.
If there’s a downside to using Timestream in Grafana, it’s the lack of a query builder. However, in practice, building the SQL queries for the dashboard panels is fairly straightforward. We also went with Telegraf to collect the metrics on our systems. It supports Timestream as a backend directly and has a ton of plugins, including a statsd plugin for any ad hoc metrics.
TL;DR
This guide covers the setup of AWS Managed Grafana using:
- Timestream for time-series data,
- Cloudwatch for application and infrastructure monitoring, and
- Telegraf as the service agent to collect and send metrics from our applications.
Step 1: Configuring Timestream
Create your Timestream database(s). Note that:
- Both Cloudformation and Terraform support Timestream.
- You can also create Timestream databases through the AWS console.
- You will need to create a Timestream database per region.
Next, create (or augment your existing) EC2 instance roles to allow writing to your Timestream database. We chose to allow our instances to create tables, so we could easily add new stats. Here’s an example policy with needed permissions and a resource constraint on the specific Timestream database:
{
  "Version": "2012-10-17",
  "Statement": [
    {
      "Action": "timestream:DescribeDatabase",
      "Effect": "Allow",
      "Resource": "arn:aws:timestream:::database/my-timestream-db"
    },
    {
      "Action": "timestream:WriteRecords",
      "Effect": "Allow",
      "Resource": "arn:aws:timestream:::database/my-timestream-db/table/*"
    },
    {
      "Action": [
        "timestream:CreateTable",
        "timestream:TagResource"
        ],
      "Effect": "Allow",
      "Resource": "arn:aws:timestream:::database/my-timestream-db/table/*"
    },
    {
      "Action": "timestream:DescribeEndpoints",
      "Effect": "Allow",
      "Resource": "*"
    }
  ]
}
Don’t forget to attach your roles, if needed.
Step 2: Create an AWS Managed Grafana Instance
Navigate to Amazon Managed Grafana in the console and click Create workspace.

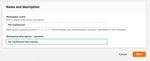
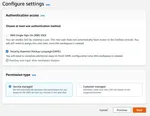
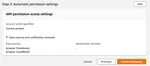
Choose your settings and click Next. We chose to let AWS manage the permissions.
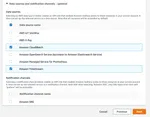
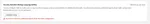
Select your data sources and click Next.
Review your options, and click Create workspace.
Enable SSO.
There are several pre-baked solutions for SAML you can choose from. You might find this AWS recipe for using SAML with Google convenient.
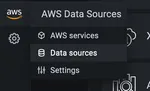
Add a Timestream data source for all of your regions. Obtain the URL to your Grafana workspace from the AWS Console, and login as an admin user. Then click the AWS icon on the left and select Data sources.
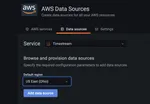
Select Timestream for the service and your region. Then click Add data source.
Step 3: Configure Telegraf
Install the Telegraf agent.
Configure the /etc/telegraf/telegraf.conf file. We’ve found it’s useful to tag the hostname, environment, and product name. Any tags you add here will get added as a column you can use to filter your Timestream queries by.
Here’s a basic configuration that adds a Timestream output, and collects CPU, Disk usage, Memory usage, and Disk IO metrics:
[global_tags]
  env = "production"
  product = "MYPRODUCT"
  server = "MYSERVERNAME"

[agent]
  interval = "10s"
  round_interval = true
  metric_batch_size = 1000
  metric_buffer_limit = 10000
  collection_jitter = "0s"
  flush_interval = "10s"
  flush_jitter = "0s"
  precision = ""
  hostname = ""
  omit_hostname = false

[[outputs.timestream]]
  region = "MYREGION"
  database_name = "MY-TIMESTREAM-DB"
  describe_database_on_start = true
  mapping_mode = "multi-table"
  create_table_if_not_exists = true
  create_table_magnetic_store_retention_period_in_days = 365
  create_table_memory_store_retention_period_in_hours = 24
  create_table_tags = { "server" = "MYSERVERNAME", "env" = "production", "product" = "MYPRODUCTNAME" }

[[inputs.cpu]]
  percpu = true
  totalcpu = true
  collect_cpu_time = false
  report_active = false

[[inputs.mem]]

[[inputs.disk]]

[[inputs.diskio]]
Take a look through the available plugins list for additional data sources.
Quick Recap
In this guide, we:
- Configured Timestream,
- Set up AWS Managed Grafana and added Timestream as a data source, and
- Set up Telegraf to write metrics to Timestream.
Coming up in part 2, we’ll discuss writing some basic Timestream queries to build panels for your dashboards. Stay tuned!
Want to work on cool enterprise software solutions like these with us? Check out our job openings.
Date
Reading Time
10 minutes
Previous article
Project Success is a Team EffortNext article
Using AWS Managed Grafana with Timestream for Observability: Writing Timestream QueriesCategory
Are you a developer? We’re hiring! Join our team of thoughtful, talented people.