Using AWS Managed Grafana with Timestream for Observability: Scheduled Tasks & Graph Annotations
In the final part of our three-part series, we use scheduled tasks and graph annotations to make our Grafana dashboards shine.
In part one, we covered the basics of creating and configuring a Grafana workspace with Timestream as a datasource. In part two, we covered some simple and intermediate Timestream queries for your Grafana panels.
For the final installment, we’ll show you how Network Ninja uses Grafana to:
- Monitor the status of scheduled tasks, and
- Add graph annotations to mark changes to our server environment.

Step 1: Scheduled Task Monitoring
With Grafana, we wanted to:
- Visualize our scheduled tasks next to our performance data, and
- Know when a job started, how long it ran for, and whether or not it completed successfully.
To get there, we wrote a wrapper script that executes our jobs, and submits that information to Timestream for viewing in Grafana via a Gantt chart panel.
The wrapper script: task-run.sh
ENVIRONMENT="prod"
PRODUCT="product-X"

# Run time vars
START_TS=$(date --iso-8601=seconds)

# Arguments
if [ -z "$2" ] ; then
    echo Usage: $0 TASK_NAME COMMAND ARGS ...
    exit 1
fi

# Run task
TASK_NAME="${1}"
BEFORE=$(date +%s)
shift 1
eval $*
RET_CODE=$?
AFTER=$(date +%s)
END_TS=$(date --iso-8601=seconds)
DURATION=$[ ${AFTER} - ${BEFORE} ]

if [ ${RET_CODE} -gt 0 ] ; then
    STATUS="FAIL"
else
    STATUS="SUCCESS"
fi

JSON="{ \"DatabaseName\": \"${DATABASE_NAME}\", \"TableName\": \"${TABLE_NAME}\", \"CommonAttributes\": { \"Dimensions\": [ { \"Name\": \"server\", \"Value\": \"${HOSTNAME}\", \"DimensionValueType\": \"VARCHAR\" } ] }, \"Records\": [ { \"Dimensions\": [ { \"Name\": \"end_time\", \"Value\": \"${END_TS}\", \"DimensionValueType\": \"VARCHAR\" }, {\"Name\": \"start_time\", \"Value\": \"${START_TS}\", \"DimensionValueType\": \"VARCHAR\" }, { \"Name\": \"status\", \"Value\": \"${STATUS}\", \"DimensionValueType\": \"VARCHAR\" }, { \"Name\": \"ret_code\", \"Value\": \"${RET_CODE}\", \"DimensionValueType\": \"VARCHAR\" }, { \"Name\": \"task\", \"Value\": \"${TASK_NAME}\", \"DimensionValueType\": \"VARCHAR\" } ], \"MeasureName\": \"duration\", \"MeasureValue\": \"${DURATION}\", \"MeasureValueType\": \"BIGINT\", \"Time\": \"${BEFORE}\", \"TimeUnit\": \"SECONDS\", \"Version\": 1 } ] }"

/usr/local/bin/aws timestream-write write-records --cli-input-json "${JSON}"
Note: the above script requires a V2 AWS CLI tool to be installed for the timestream-write command. We use the wrapper to execute our jobs by invoking them like this:
/usr/local/bin/task-run.sh TASKNAME COMMAND ARGS ...
For example:
/usr/local/bin/task-run.sh DBTASKS /usr/local/bin/db-tasks.sh 'full'
To view this data, add a new panel to your dashboard and set the type to Gantt in the upper right hand corner.
Then use the following query:
SELECT * FROM "my-timestream-db"."scheduled_tasks"
WHERE (from_iso8601_timestamp(start_time) between
from_iso8601_timestamp('${__from:date:iso}') and
from_iso8601_timestamp('${__to:date:iso}')
or from_iso8601_timestamp(end_time) between
from_iso8601_timestamp('${__from:date:iso}') and
from_iso8601_timestamp('${__to:date:iso}'))
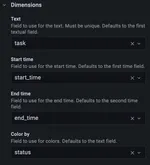
AND server='${server}'Under the Dimensions section on the right:
- Set the “Text” field to task
- Set the “Start time” field to start_time
- Set the “End time” field to end_time
- Set the “Color by” field to status
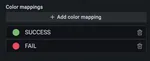
Under the Color mappings section, add a color mapping for SUCCESS and set it to a green color. Add another color mapping for FAIL and set it to a red color. It should look like this:
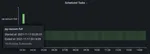
Click the Save button and visualize your scheduled tasks.
Step 2: Add Graph Annotations
Annotations - which are notes to explain or comment on graphs - are useful in a variety of situations. We use them to mark deployments, configuration changes, and attribute performance behavior to specific events (like making rollback decisions, so others know when and why you made them).
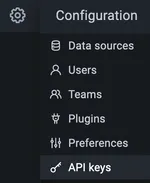
You can submit graph annotations to Grafana using a Grafana API key. To create a key, select the API keys option from the configuration gearbox menu on the left.
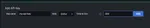
Click Add API key, and give it the Editor role. At the time of this writing, you’ll need to put 30d, or shorter, as the Time to live interval, because AWS Managed Grafana doesn’t support longer-lived API keys (this is unfortunate because regular Grafana doesn’t have this limitation). You may wish to add your voice to ours by letting AWS know this is artificially short!
Save the API key and handle it with care.
Next, we wrote this script to submit annotations to Grafana: annotate.sh
#!/bin/bash
SERVER="my-server"
PRODUCT="my-product"
ENV="prod"
APIKEY="YOURAPIKEY"
GRAFANA_URL="https://YOURGRAFANAWORKSPACE.grafana-workspace.REGION.amazonaws.com/api/annotations"

if [ -z "$1" ] ; then
    echo "Usage: $0 tag1 tag2:value tag3 ..."
    exit 1
fi

# Seconds from the epoch times a thousand.
TIME=$[ $(date +%s) * 1000 ]

# Get our message text.
read MESSAGE

# Using a sed hack here as a quasi join() function because json doesn't like
# trailing commas.
TAGS=$(echo $* | sed 's/ /\", \"/g')

# Assemble our json.
JSON="{ \"tags\":[\"${TAGS}\", \"${SERVER}\", \"${PRODUCT}\", \"${ENV}\" ], \"time\": ${TIME}, \"text\": \"${MESSAGE}\" }"

# Submit the annotation.
curl \
    -X POST \
	-H "Authorization: Bearer ${APIKEY}" \
	-H "Content-Type: application/json" \
    -d "${JSON}" \
    $GRAFANA_URL
You’ll need to substitute the variables at the top of the script to suit your needs, or add secret handling as appropriate for your environment.
To view annotations on your dashboard, go to your Grafana dashboard settings and click the Annotations tab.
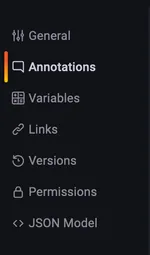
Click the + New Query button. Add a Name, such as “Deployments”, and choose Grafana as the Data source. Choose a color, and add a tag (for example, your server name) in the Query box.
Next, run the annotate.sh script on your server like the following:
/usr/local/bin/annotate.sh tag1 tag2:value tag3 ...
$ echo "This is a test" | /usr/local/bin/annotate.sh test test_version:1.2.3
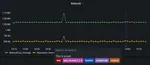
{"id":108,"message":"Annotation added"}Finally, view the annotation on your dashboard.
Quick Recap
In this guide, we:
- Created a wrapper script for scheduled task monitoring,
- Added a Gantt chart in Grafana to visualize that task data, and
- Set up graph annotations to provide additional context for our graphs.
This concludes our article series on Network Ninja’s approach to using AWS Managed Grafana for server observability. If you haven’t already, be sure to check out part 1 and part 2.
Good luck, and happy monitoring!
We’re hiring. If you want to join our 100% remote (work from home) crew, check out our current job listings.
Date
Reading Time
15 minutes
Previous article
Using AWS Managed Grafana with Timestream for Observability: Writing Timestream QueriesCategory
Are you a developer? We’re hiring! Join our team of thoughtful, talented people.